
Data is meaningless if you don’t do something with it!
To make the data meaningful, BlueVolt has designed the Aggregated Performance Dashboard as part of our Business Intelligence (BI) capabilities.
This workhorse of a dashboard gives administrators the big picture of what’s going on. It’s divided into key sections that offer the best visual view of your data.
Let's look at the top 5 ways for you to leverage your BlueVolt BI dashboard.
Rolling Performance Chart
In this chart, administrators can see data over time related to enrollment in product training courses, completion of those courses, and additional eCommerce activities.
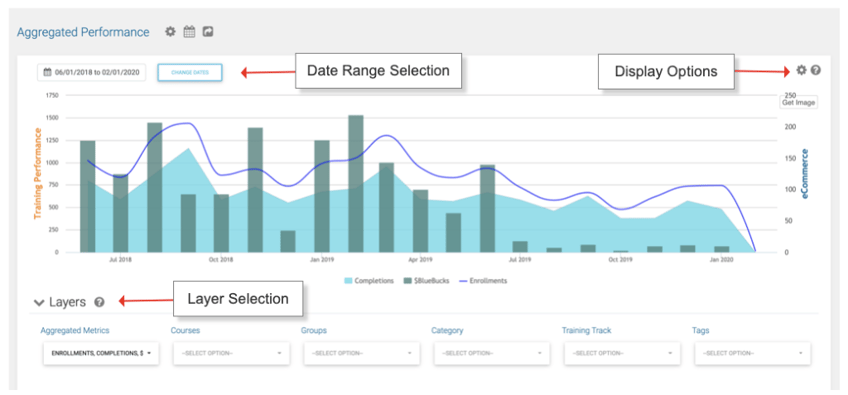
What can I do with this data?
Course enrollment numbers prove how many people are signing up for your product training courses. Not enough enrollments? Promote courses to partners or work with your Customer Success Manager (CSM) to make more network connections. Using your data to figure out why things are happening can help you pivot, change up your courses, create more valuable materials, and increase your sales numbers.
Insights Panels
Curious about your key performance indicators (KPIs)? BlueVolt’s Insights Panels provide a performance view of these KPIs. On the dashboard, you’ll see KPI changes over time from the previous period.
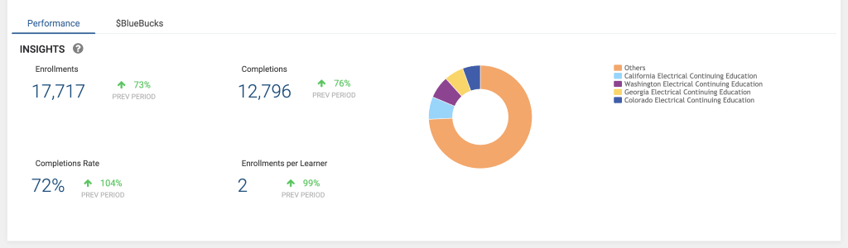
What can I do with this data?
Like the Rolling Performance Chart, the Insights Panels give you at-a-glance information about the most important details. Knowing the number of enrollments, completions, and how many courses each person enrolls in helps you make better decisions in real-time. Through making simple, data-driven changes to your processes, you can improve multiple KPIs simultaneously.
ECommerce Panel
If your university uses the active eCommerce configuration, then you will have access to the eCommerce Panel. (Don’t worry. You can always contact your CSM if you want to activate this feature).
This panel provides a summary of core sales. Data posted here includes numbers from direct University sales and numbers from courses sold through partners in the BlueVolt Sharing Center.
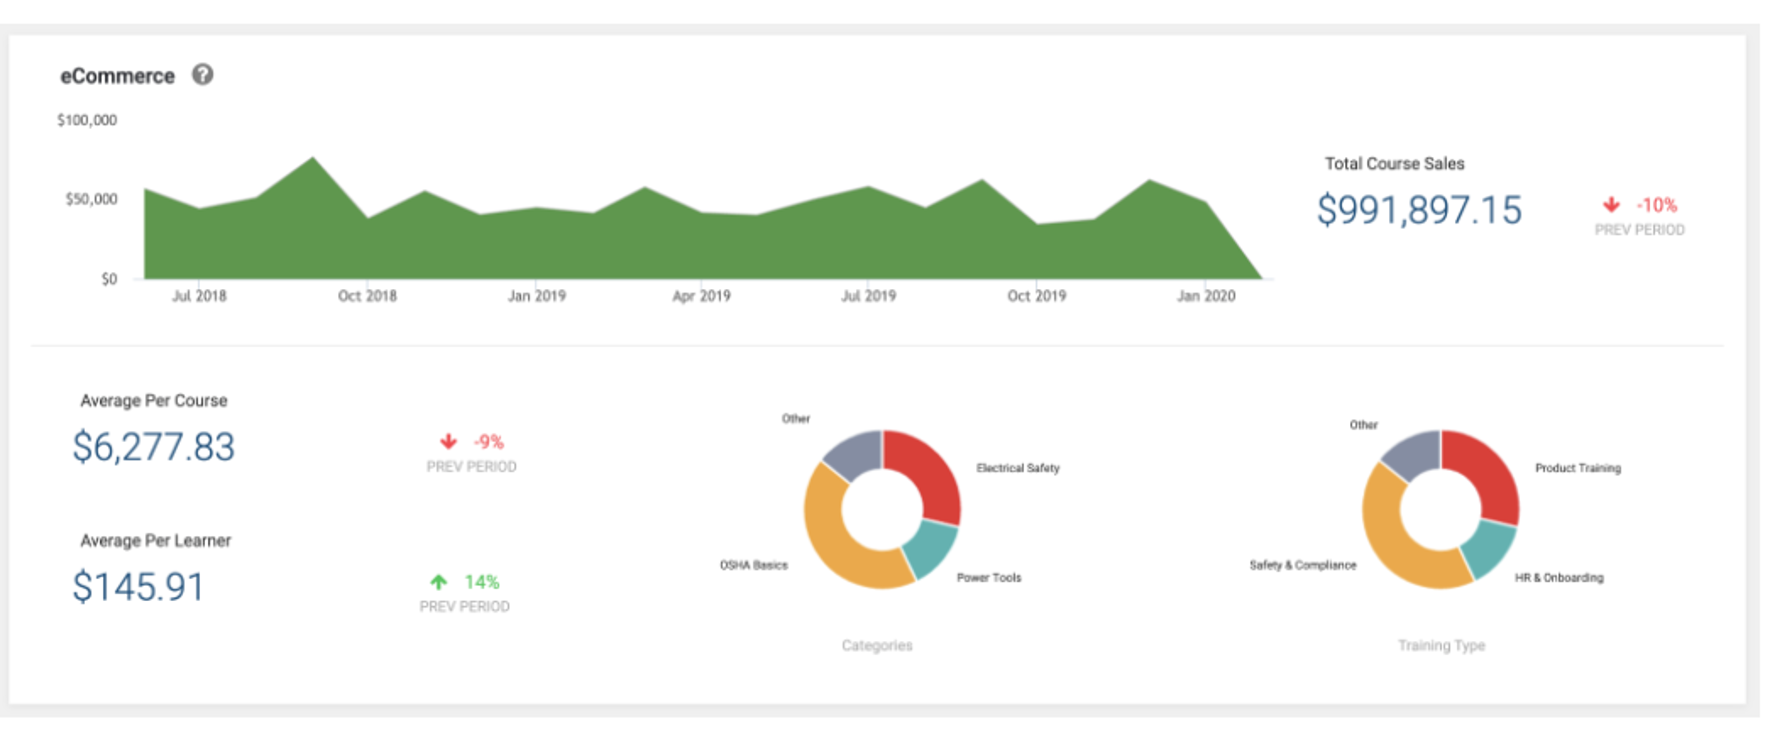
What can I do with this data?
Data from this panel can prove whether selling your courses is worth the continued investment. Is the information you’re providing valuable enough to attract more sales? Should your organization invest further resources into creating more sellable assets? This data justifies your plans moving forward.
Leaderboards
Your University will either host or subscribe to product training materials, so it’s essential to know which of those training courses are getting the most and least action. Leaderboards let you see the top-performing courses and course tracks, as well as the bottom performing ones.
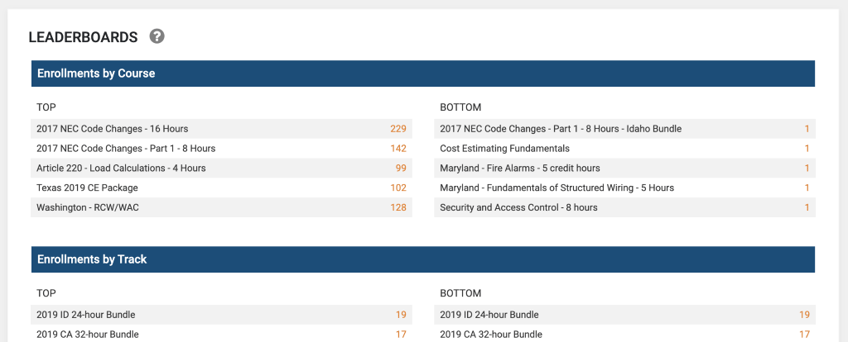
What can I do with this data?
If you are providing product training courses, having real-time data of which courses are performing well helps you plan future content. If you are subscribing to product training courses through your partners, this data can help you measure the value of those partner relationships.
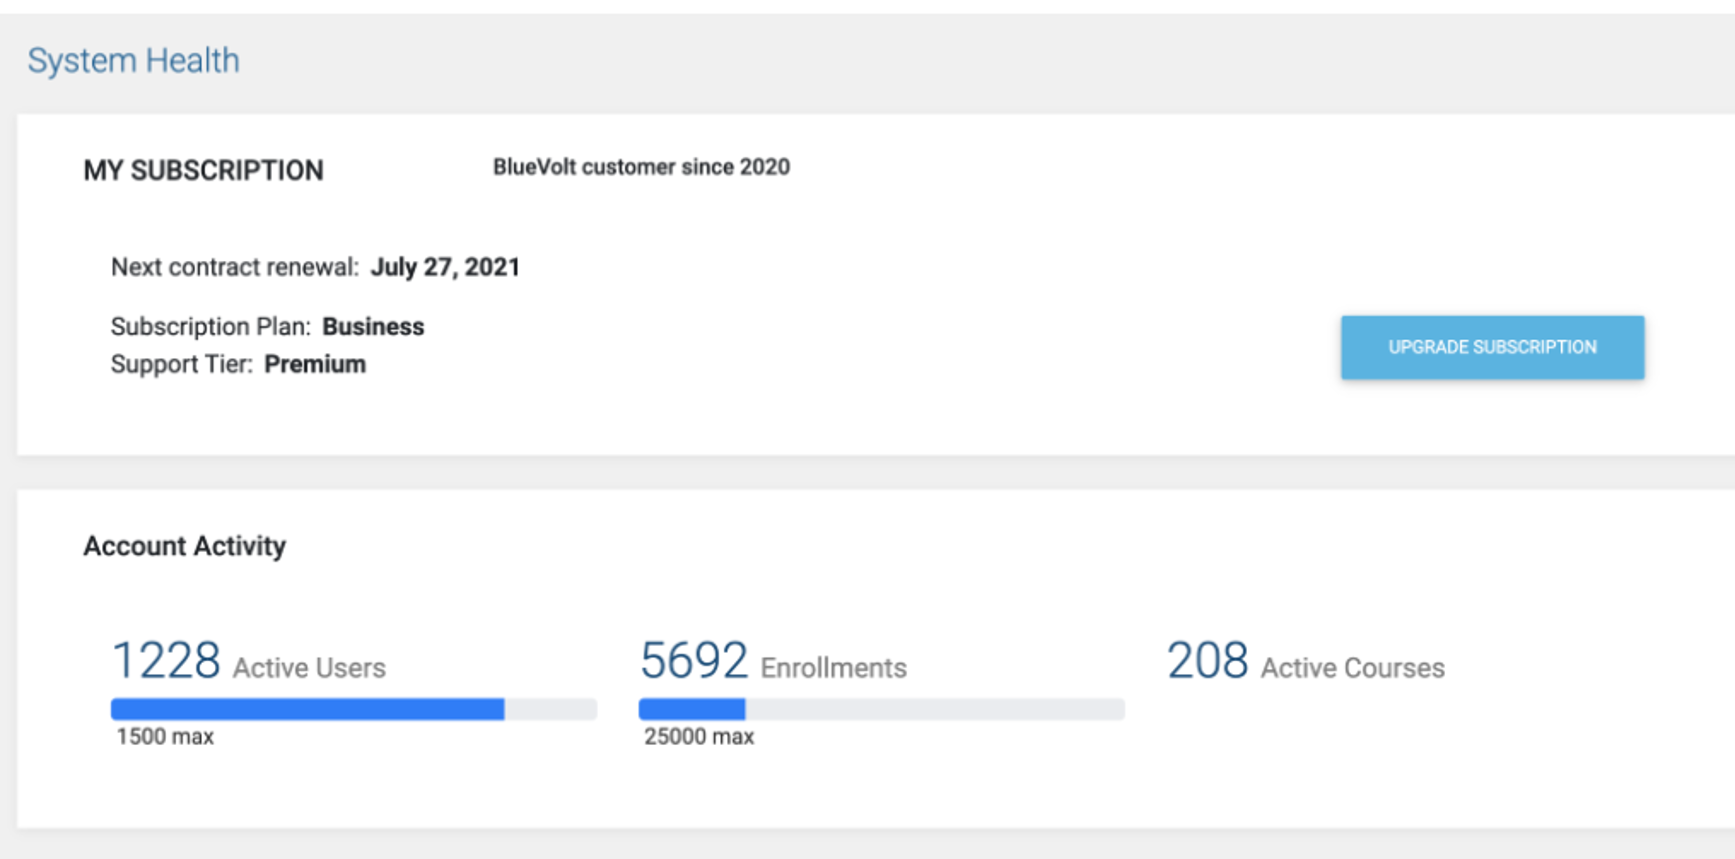
My Subscription Dashboard
This last dashboard is only viewable to University administrators. It helps you understand your subscription level by viewing the number of active users you have, the number of enrollments, and how many active courses you provide.
What can I do with this data?
Keeping an eye on your Subscription Dashboard shows how close you are to hitting your maximums per your current subscription plan. As you grow with BlueVolt, watching these numbers helps you scale at the right rate for your business. Likewise, as you get closer to your contract renewal date, you’ll have exact numbers to demonstrate the value of upgrading your subscription.
You can do much more with your dashboards, and your CSM is ready to chat about how you can proactively use your data. Reach out to them directly or contact them here.

Want to know how BlueVolt’s BI dashboards can help your organization make better use of their data? Request a call from BlueVolt