As part of the BlueVolt 2021 Summer Release, we have enhanced customer analytics dashboards to provide more insights about product training course completions, enrollments, and learner progress.
While there are several enhancements, this blog will focus on the new look and functionality of the Leaderboards section.
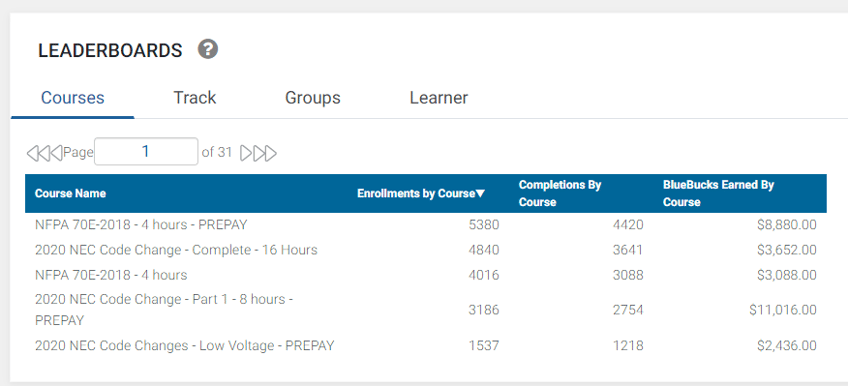
At first glance, BlueVolt customers will notice some key differences in the organizational style of the information. Admins can now choose how they view leaderboard data related to Courses, Tracks, Groups, or Learners. Just click any one of these four tabs on the top to change the corresponding data below.
Admins can view real-time info on how any of these four categories connect with Enrollments, Course Completions, or $BlueBucks Earned. Choose different date ranges to compare information as needed.
Want to sort each column to view highest to lowest and vice versa? Click on any of the column headers, and the data will align with your preferences.
Tips & Tricks for Leveraging Leaderboards
Planning Future Content Needs
Suppliers and other content creators can review leaderboards to see which courses are performing the best. For example, if a course on how to use a tool for installation performed well on the Leaderboards, creating similar how-to courses may also get high enrollment and completion rates.
Awarding Top Learners and Groups
For most BlueVolt-powered Universities, learner incentivization happens through the $BlueBucks program or something similar. But a little extra competition never hurt anyone in sales!
By clicking on the Learner or Group tabs on the Leaderboards section, Admins can easily track who enrolls and completes the most courses. Announcing this type of information during standups motivates learners and promotes some healthy competition.
Finding The Incentive Strategy That Works
Multiple reports about learning management systems have proved that incentives work to get learners to enroll and complete courses, but how much should you offer? The BlueVolt Insights Report from 2020 noted that offering at least three $BlueBucks resulted in the highest average percentage of course completions at 95%.
That doesn’t mean that fewer or more incentives won’t work. The data simply highlights an average. But by using the Leaderboards section on your dashboard, you can start gathering data to see which courses perform the best concerning the amount of $BlueBucks you offer. This data may help you make adjustments to incentives.
Engage with the BlueVolt Analytics Enhancements Today
We invite our BlueVolt customers to explore their analytics dashboard today. Additional analytics training is in the pipeline for customers, so stay tuned. To ensure you don't miss any updates, sign-up today for the BlueVolt News & Blogs Mailing List by clicking here.