 Your data impacts your business, but do you review that information using analytics or business intelligence (BI)?
Some leaders confuse these concepts or use them interchangeably, but they are not the same thing. Yes, you can use these tools to analyze your business data, but each tool offers a different perspective on your whole data story.
Understanding the distinction between these two concepts proves critical, especially when considering vendors that offer analytics and BI tools. Organizations need the tools that best suit their purposes, so choosing the right solution for your data needs is vital for business success.
To grow your understanding of these two concepts and determine your needs, let's take a deeper dive into how analytics and BI individually contribute to your metrics. By the end of this article, you will understand how these tools show the bigger picture of how your company's data builds the story of your business.
What Is the Difference between Analytics and BI?
Analytics answer the why questions. For example, why have sales gone up and down over the past year?
By mining through the data and running some statistical analyses, businesses can predict what will happen to sales based on what has already happened. Predictive modeling methods allow companies to make smarter data-driven decisions.
BI focuses more on what specific elements contributed to changes in the business. Instead of predicting what will happen, BI digs down into the descriptive-analytical data to provide keen insights on what exactly happened.
While they are different, these tools work together.
BI tools allow professionals to create data spreadsheets and trend reports based on what happened. Analytics tools can use this information to predict what will most likely happen down the road.
From clean, meaningful data, professionals can apply these methodologies to explore the data and extract valuable insights about different elements of the business.
Does BlueVolt Offer Analytics and BI Tools?
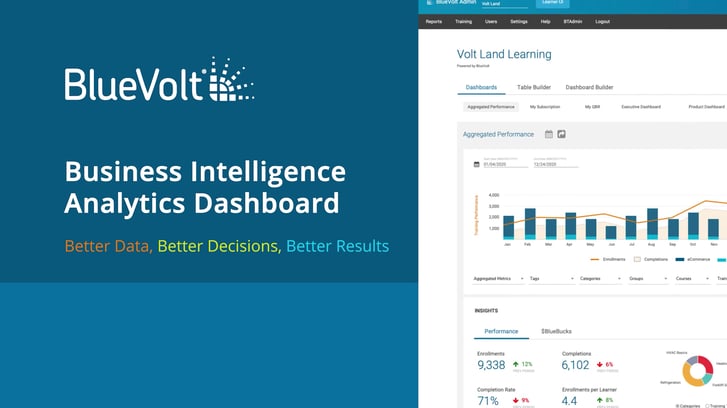
Yes — BlueVolt's Embedded Analytics Suite offers customers a variety of ways to review their data and answer all the why questions (analytics), and then dig deeper to determine what happened (BI).
For companies who use BlueVolt's platform for product training and/or skills development, the analytics and BI tools baked into the platform can reveal important insights that will impact their training strategies, such as:
- Top-performing training courses that get more enrollments
- Learners' progress with completing training
- Connections between sales growth and completing training courses
- Training gaps and underperforming courses to address
By monitoring data on a regular basis using BlueVolt's solutions, our customers can make changes to their training strategy in real-time. Since most of our customers are looking to grow their brand reach, increase sales, and develop team members, these analytics and BI tools prove essential for them to both achieve and monitor their goals.
Looking for More Info on Training Trends and Analytics?
Finding trends in your own LMS training platform is important, but reviewing the training trends of companies in similar industries can show you how you stack up. That's why BlueVolt created the Insights Report.
This document offers an anonymized view of all our customers' training platforms throughout 2020 to identify which factors impact training and which trends prove the most crucial.
Download your complimentary copy of this report today by going here.
To learn more about analytics, we recommend the following BlueVolt Blogs:
- Mistakes to Avoid When Designing Analytics Dashboards
- Delivering Robust Analytics Starts with a Good Partnership
- BlueVolt Analytics Enhancements: Leveraging Leaderboards
*This blog was originally published by BlueVolt in May 2021. It has been updated and additional resources added.